A Change in Seasons as seen from Space
Geostationary satellite imagery from Himawari-8
Viewing Earth’s Tilt from a Himawari True-Colour Dashboard
This dashboard is built around a simple but powerful idea: by viewing the same geostationary satellite scene at fixed UTC times each day, the seasonal geometry of Earth becomes visible. By stepping through daily Himawari images captured in the morning (20:00 UTC), midday (02:00 UTC), and afternoon (08:00 UTC), the dashboard reveals how Earth’s axial tilt modulates the angle and extent of solar illumination throughout the year. Over weeks and months, slow, predictable astronomical signals begin to emerge clearly from the otherwise chaotic evolution of clouds and weather.
Because Himawari-9 is a geostationary satellite, it maintains a fixed viewing position approximately 35,786 km above the equator, continuously observing the same hemisphere. This stable perspective isolates changes driven purely by Sun–Earth geometry rather than orbital motion. Two features in particular stand out. The day–night boundary (the terminator) forms a sharp transition between illuminated and dark regions of the disk, and its orientation rotates systematically through the year. Near the equinoxes, the terminator appears more upright relative to the equator, reflecting near-equal day and night lengths globally. Near the solstices, it becomes strongly tilted, with the illuminated portion of the disk expanding into one hemisphere and contracting in the other. Because the dashboard samples the same UTC times each day, this gradual seasonal rotation becomes especially easy to track.
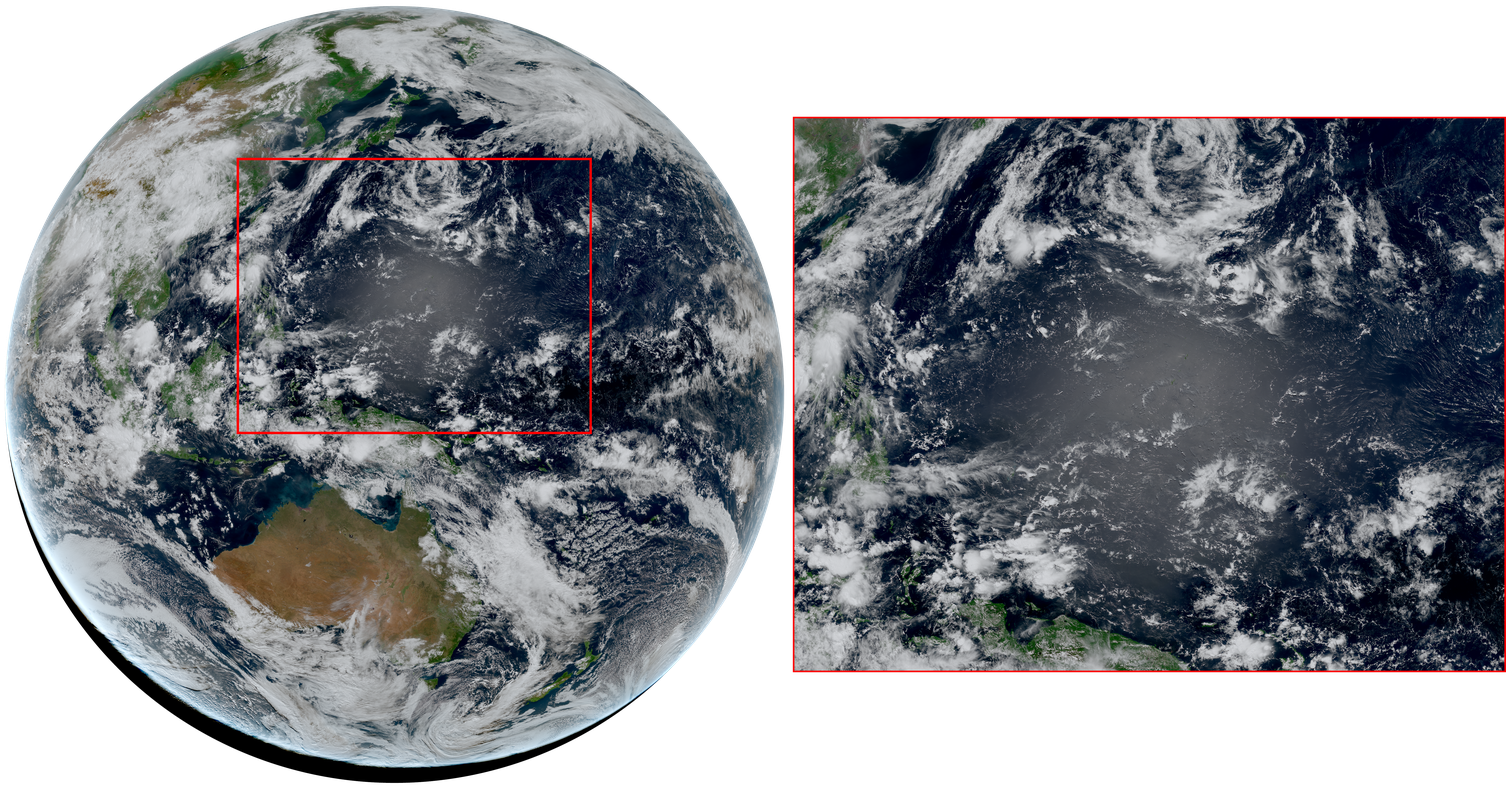
A second geometric signature is sunglint, the mirror-like reflection of sunlight from the ocean surface when the Sun, sea, and satellite align. In true-color imagery, sunglint appears as a broad, smooth, silvery region over the ocean, often distinct from the textured appearance of clouds. As the Sun’s apparent position shifts with the seasons, the sunglint region migrates across the Pacific, acting as a natural tracer of changing illumination geometry. While sunglint is often treated as a complication in ocean-color remote sensing, here it provides an intuitive visual cue for how the Sun–Earth–satellite alignment evolves through the year.
The imagery shown in the dashboard consists of true-color RGB composites generated from the Advanced Himawari Imager (AHI) using visible spectral bands that approximate human vision. These images are produced from open Level-1 satellite data using an open-source processing pipeline based on the Satpy Python package, including atmospheric correction, resampling to a geostationary grid, and export to web-friendly PNG images. Together, the fixed satellite perspective, consistent daily sampling, and interactive playback transform geostationary imagery into a clear and intuitive visual tool for understanding Earth–Sun geometry across the seasons.
Useful Resources
Tools:
- Real-Time Geostationary Satellites Viewer: RAMMB/CIRA SLIDER
Himawari:
- Japan Meteorological Agency (JMA) – Himawari-8/9: Here
- Advanced Himawari Imager (AHI) Band Information: Here
Data Processing
Applications
- EUMETSAT SAF: Here